On the shoulders of giants
The famous quote from Newton: “If I have seen further, it is by standing on the shoulders of giants" usually refers to how science is built on top of previous knowledge, with researchers basing their results on the works of scientists who came before them. One could reframe it by saying that scientific knowledge is reusable. This is a fundamental principle in the scientific community: once a result is published, anyone can read it, learn how it was achieved, and then use it as a basis for further research. Reusing knowledge is also ingrained in the practice of scientific research as the basis of verifiability. In natural sciences, the scientific method demands that experimental data back your claims. In mathematical research, the logic construction demands mathematical proof of your claims. This means that for a good scientific practice, your results must be verifiable by other researchers, and this verification requires a reuse of not only the mental processes but also the data and tools used in the research.
Research data must be as reusable as the results and publications they support. From the perspective of modern, intensively data-driven science, this demand poses some challenges. Some barriers to reusability are technical, because of incompatibilities of standards or systems, and this problem is largely covered in the Interoperability principle of FAIR. But other problems such as poor documentation or legal barriers can be even bigger obstacles than technical inconveniences.
Reuse of research data is the ultimate goal of FAIR principles. The first three principles (Findable, Accessible, Interoperable) are necessary conditions for effective reuse of data. What we list here as “Reusability” requirements are all the remaining conditions, often more subjective or harder to evaluate, that appeal to the final goal of having a piece of research data embedded in a new chain of results.
To be precise, the Reusability principle requires data and metadata to be richly characterised with descriptors and attributes. Anyone potentially interested in reusing the data should easily find out if that data is useful for their purposes, how it can be used, how it was obtained, and any other practical concerns for reusing it. In particular, data and metadata should be:
- associated with detailed provenance
- released with a clear and accessible data usage license.
- broadly aligned with agreed community standards of its discipline.
Documentation
It is essential for researchers to acknowledge that the research data they generate is a first-class output of their scientific research and not only a private sandbox that helps them produce some public results. Hence, research data needs to be curated with reusability in mind, documenting all details (even some that might seem irrelevant or trivial to its authors) related to its source, scope, or use. In data management, we use the term “provenance” to describe the story and rationale behind that data. Why does it exist, what problem was it addressing, how it was gathered, transformed, stored, used… all this information might be relevant for a third party that first encounters the data and has to judge if it is relevant for themselves or not.
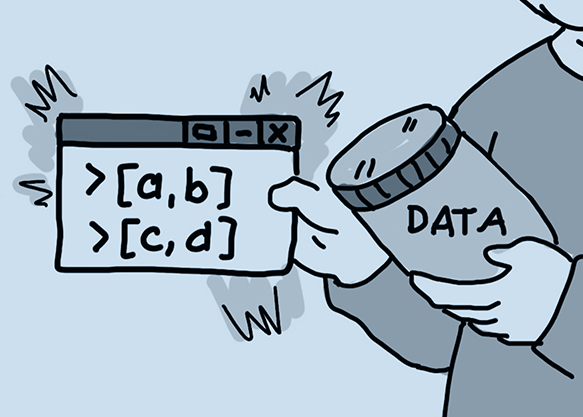
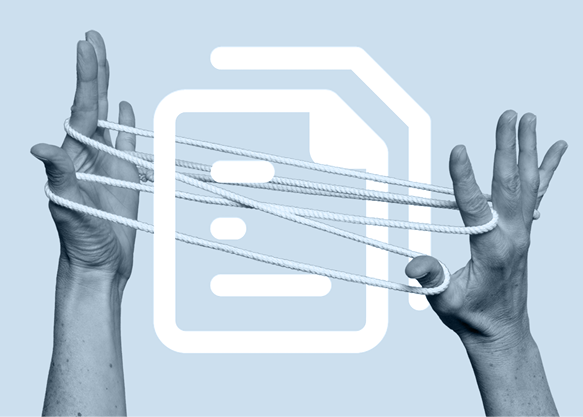
In experimental data, it is important to document exactly what was the purpose of the experiment, which protocol was followed to gather the data, who did the fieldwork (in case that contact information is needed), which variables were recorded, how the data is organized, which software was used, which version of the dataset it is, etc. As an antithesis of the ideal situation, imagine that you, as a researcher, find out about an article that uses some statistical data that you think you could reuse or that you want to look at as a referee. The data is easily available, and it is in a format that you can read. The data, however, is confusing. The fields on the tables have cryptic names such as “rgt5” and “avgB” that are not defined anywhere, leaving you to guess their meaning. Units of the measures are missing. Some registries are marked as “invalid” without any explanation of the reason and without making clear whether those registries were used or not on calculations. Derived data is calculated from a formula, but the implementation in the spreadsheet is slightly but significantly different than the formula in the article. If you re-run the code, the results are thus a bit different from those stated in the article. At some point, you try to contact the authors, but the contact data is outdated, or it is unclear who of several authors can help with the data (you can picture such a scene in this animated short video). Note that in this scenario we describe, the research data might have been perfectly Findable, Accessible and technically good and Interoperable, but without attention to those Reusable requirements, the whole purpose of FAIR data is defeated.
In computer-code data, documentation and good community development practices are non-trivial issues the industry has been addressing for a long time. Communities of programmers concerned by these problems have developed tools and protocols that solve, mitigate, or help manage these issues. Ideally, scientists working on scientific computing should learn and follow those good practices for code management. For instance, package managers for standard libraries, version control systems, continuous integration schemes, automated testing, etc., are standard techniques in the computer industry. While not using any of these techniques and just releasing source code in zip files might not break F-A-I principles, it will make reuse and community development much more difficult.
Documenting algorithms is especially important. Algorithms frequently use tricks, constants that get hard-coded, code patterns that come from standard recipes, parts that handle exceptional cases… Most often, even a very well-commented code is not enough to understand the algorithm, and a scientific paper is published to explain how the algorithm works. The risk is having a mismatch between the article that explains the algorithm, and the released production-ready code that implements it. If the code implements something similar but not exactly what is described in the article, there is a gap where mistakes can enter. Having a close integration between the paper and the code is crucial to prevent the newcomer from having to rework how the described algorithm translates into code.
Verifiability
As we introduced above, independent verification is a pillar of scientific research, and verification cannot happen without reusability of all necessary research data. MaRDI puts a special effort into enabling verification of data-driven mathematical results, by building FAIR tools and exchange platforms for the fields of computer algebra, numerical analysis, and statistics and machine learning.
An interesting example arises in computer algebra research. In that field, output results are often as valuable by themselves as the program that produced them. For instance, classifications and lists are valuable by themselves (see for example the LMFDB or MathDB sites for some classification projects). Once that list is found, it can be stored and reused for other purposes without any need to revisit the algorithm that produced such a list. Hence, the focus is normally on reusability of the output, but forgetting the reusability of the sources. This neglects to describe the provenance of the data, how it was created, which techniques were used to find it. This entails serious risks. Firstly, it is essential to verify that the list is correct (since a lot of work will be carried out assuming it is). Secondly, it is often the case that later research needs a slight variation of the list offered in the first place, so researchers need to modify parameters or characteristics of the algorithm to create a modified list.
In the case of numerical analysis, the output algorithms are usually focused on user reusability, often in the form of computing packages or libraries. However, several different algorithms may compete for accuracy, speed, hardware requirements, etc., so the “verification” process gets replaced by a series of benchmarks that can rate an algorithm in different categories and verify its performance. We have described, in the previous newsletter, how MaRDI would like to make numerical algorithms easier to reuse and benchmark them in different environments.
As for statistical data, our Interoperability issue of the newsletter describes how MaRDI curates datasets with “ground truths,” known facts that we know for sure independently from the data, that allow for the validation of new statistical tools to be applied to the data. In this case, re-using these new statistical tools on new studies increases the corpus of cases where the tool has been successfully used, making each reuse a part of the validation process.
Licenses
We also discussed licenses in our Accessibility issue. Let’s recall that FAIR principles do not prescribe free / open licenses, although those licenses are the best way to allow unrestricted reusability. However, FAIR principles do require a clear statement of the license that applies, be it restrictive or permissive.
Even within free/open licenses, the choice is wide and tricky. In software, open source licenses (e.g. MIT, Apache licenses) refer to the fact that the source code must be provided to the user. Those are amongst the most permissive because with the code one can study, run, or modify it. In contrast, free software licenses (e.g. GPL) carry some restrictions and an ethical/ideological load. For instance, many free licenses include copyleft, which means that any derived work must keep the same license, effectively preventing a company to bundle this software in a proprietary package that is not free software.
In creative works (texts, images…), the Creative Commons licenses are the standard legal tool to explicitly allow redistribution of works. There are several variants, ranging from almost no restrictions (CC0 / Public domain), to including clauses for attribution (CC-BY, attribution), sharing with the same license (CC-SA, share alike), or restricting commercial use (CC-NC, non-commercial) or derivative works (CC-ND, non-derivative), and any compatible combination. For databases, the Open Database License (ODbL) is a widely used open license, along with CC.
The following diagram shows how you can determine which CC license would be appropriate for you to use:

Diagram on Intellectual Property and Creative Commons by MaRDI,
licensed under CC BY-NC-ND


Conference on Research Data Infrastructure
The Conference will take place September 12th – 14th, 2023, in Karlsruhe (Germany). There will be disciplinary tracks and cross-disciplinary tracks.
Abstract submissions deadline: April 21, 2023
More information:
- in English
IceCube - Neutrinos in Deep Ice
This code competition aims to identify which direction neutrinos detected by the IceCube neutrino observatory came from. PUNCH4NFDI is focused on particle, astro-, astroparticle, hadron, and nuclear physics, and is supporting this ML challenge.
Deadline: April 23, 2023
More Information:
- in English
Open Science Radio
Get an overview of all NFDI consortia funded to date, and gain an insight into the development of the NFDI, its organizational structure, and goals in the 2-hour Open Science Radio episode interviewing Prof. Dr. York Sure-Vetter, the current director of the NFDI.
Listen:
- in English
The DMV, in cooperation with the KIT library, maintains a free self-study course on good scientific practice in mathematics, including notes on the FAIR principles. (Register here to subscribe to the free course.)
Edmund Weitz of the University of Hamburg recorded an entertaining chat about mathematics with ChatGPT (in German).
Remember our interview about accessibility with Johan Commelin in the second MaRDI Newsletter? The Xena Project is "an attempt to show young mathematicians that essentially all of the questions which show up in their undergraduate courses in pure mathematics can be turned into levels of a computer game called Lean". It has published a blog post highlighting very advanced maths, which can now be understood using the interactive theorem prover Lean Johan told us about.
On March 14, the International Day of Mathematics was celebrated worldwide. You can relive the celebration through the live blog, which also includes two video sessions with short talks for a general audience—one with guest mathematicians and one with the 2022 Fields Medal laureates. This year, the community was asked to create Comics. Explore the featured gallery and a map with all of the mathematical comic submissions worldwide.
The knowledge ladder
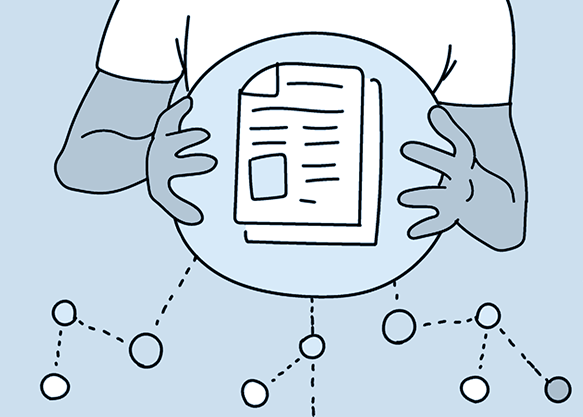
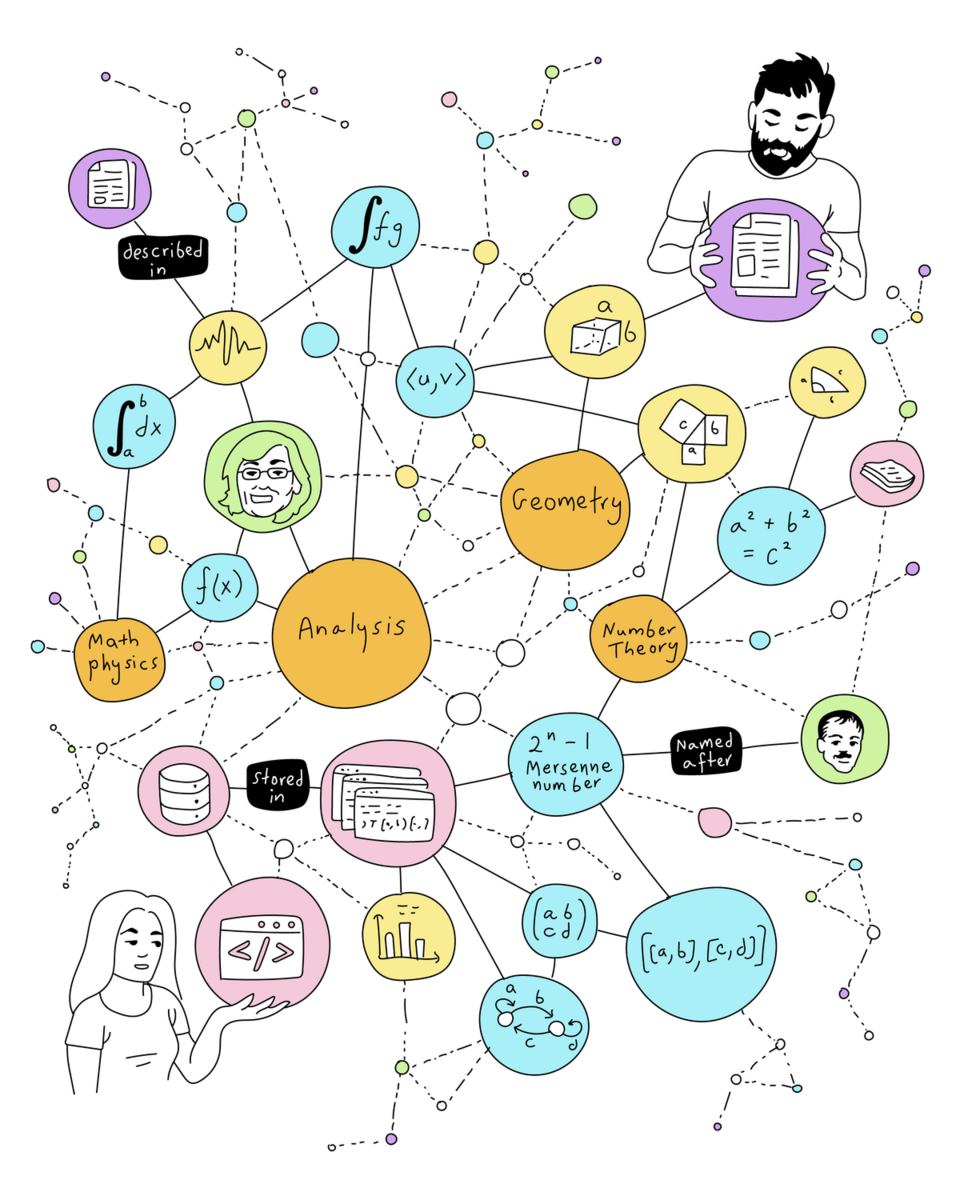
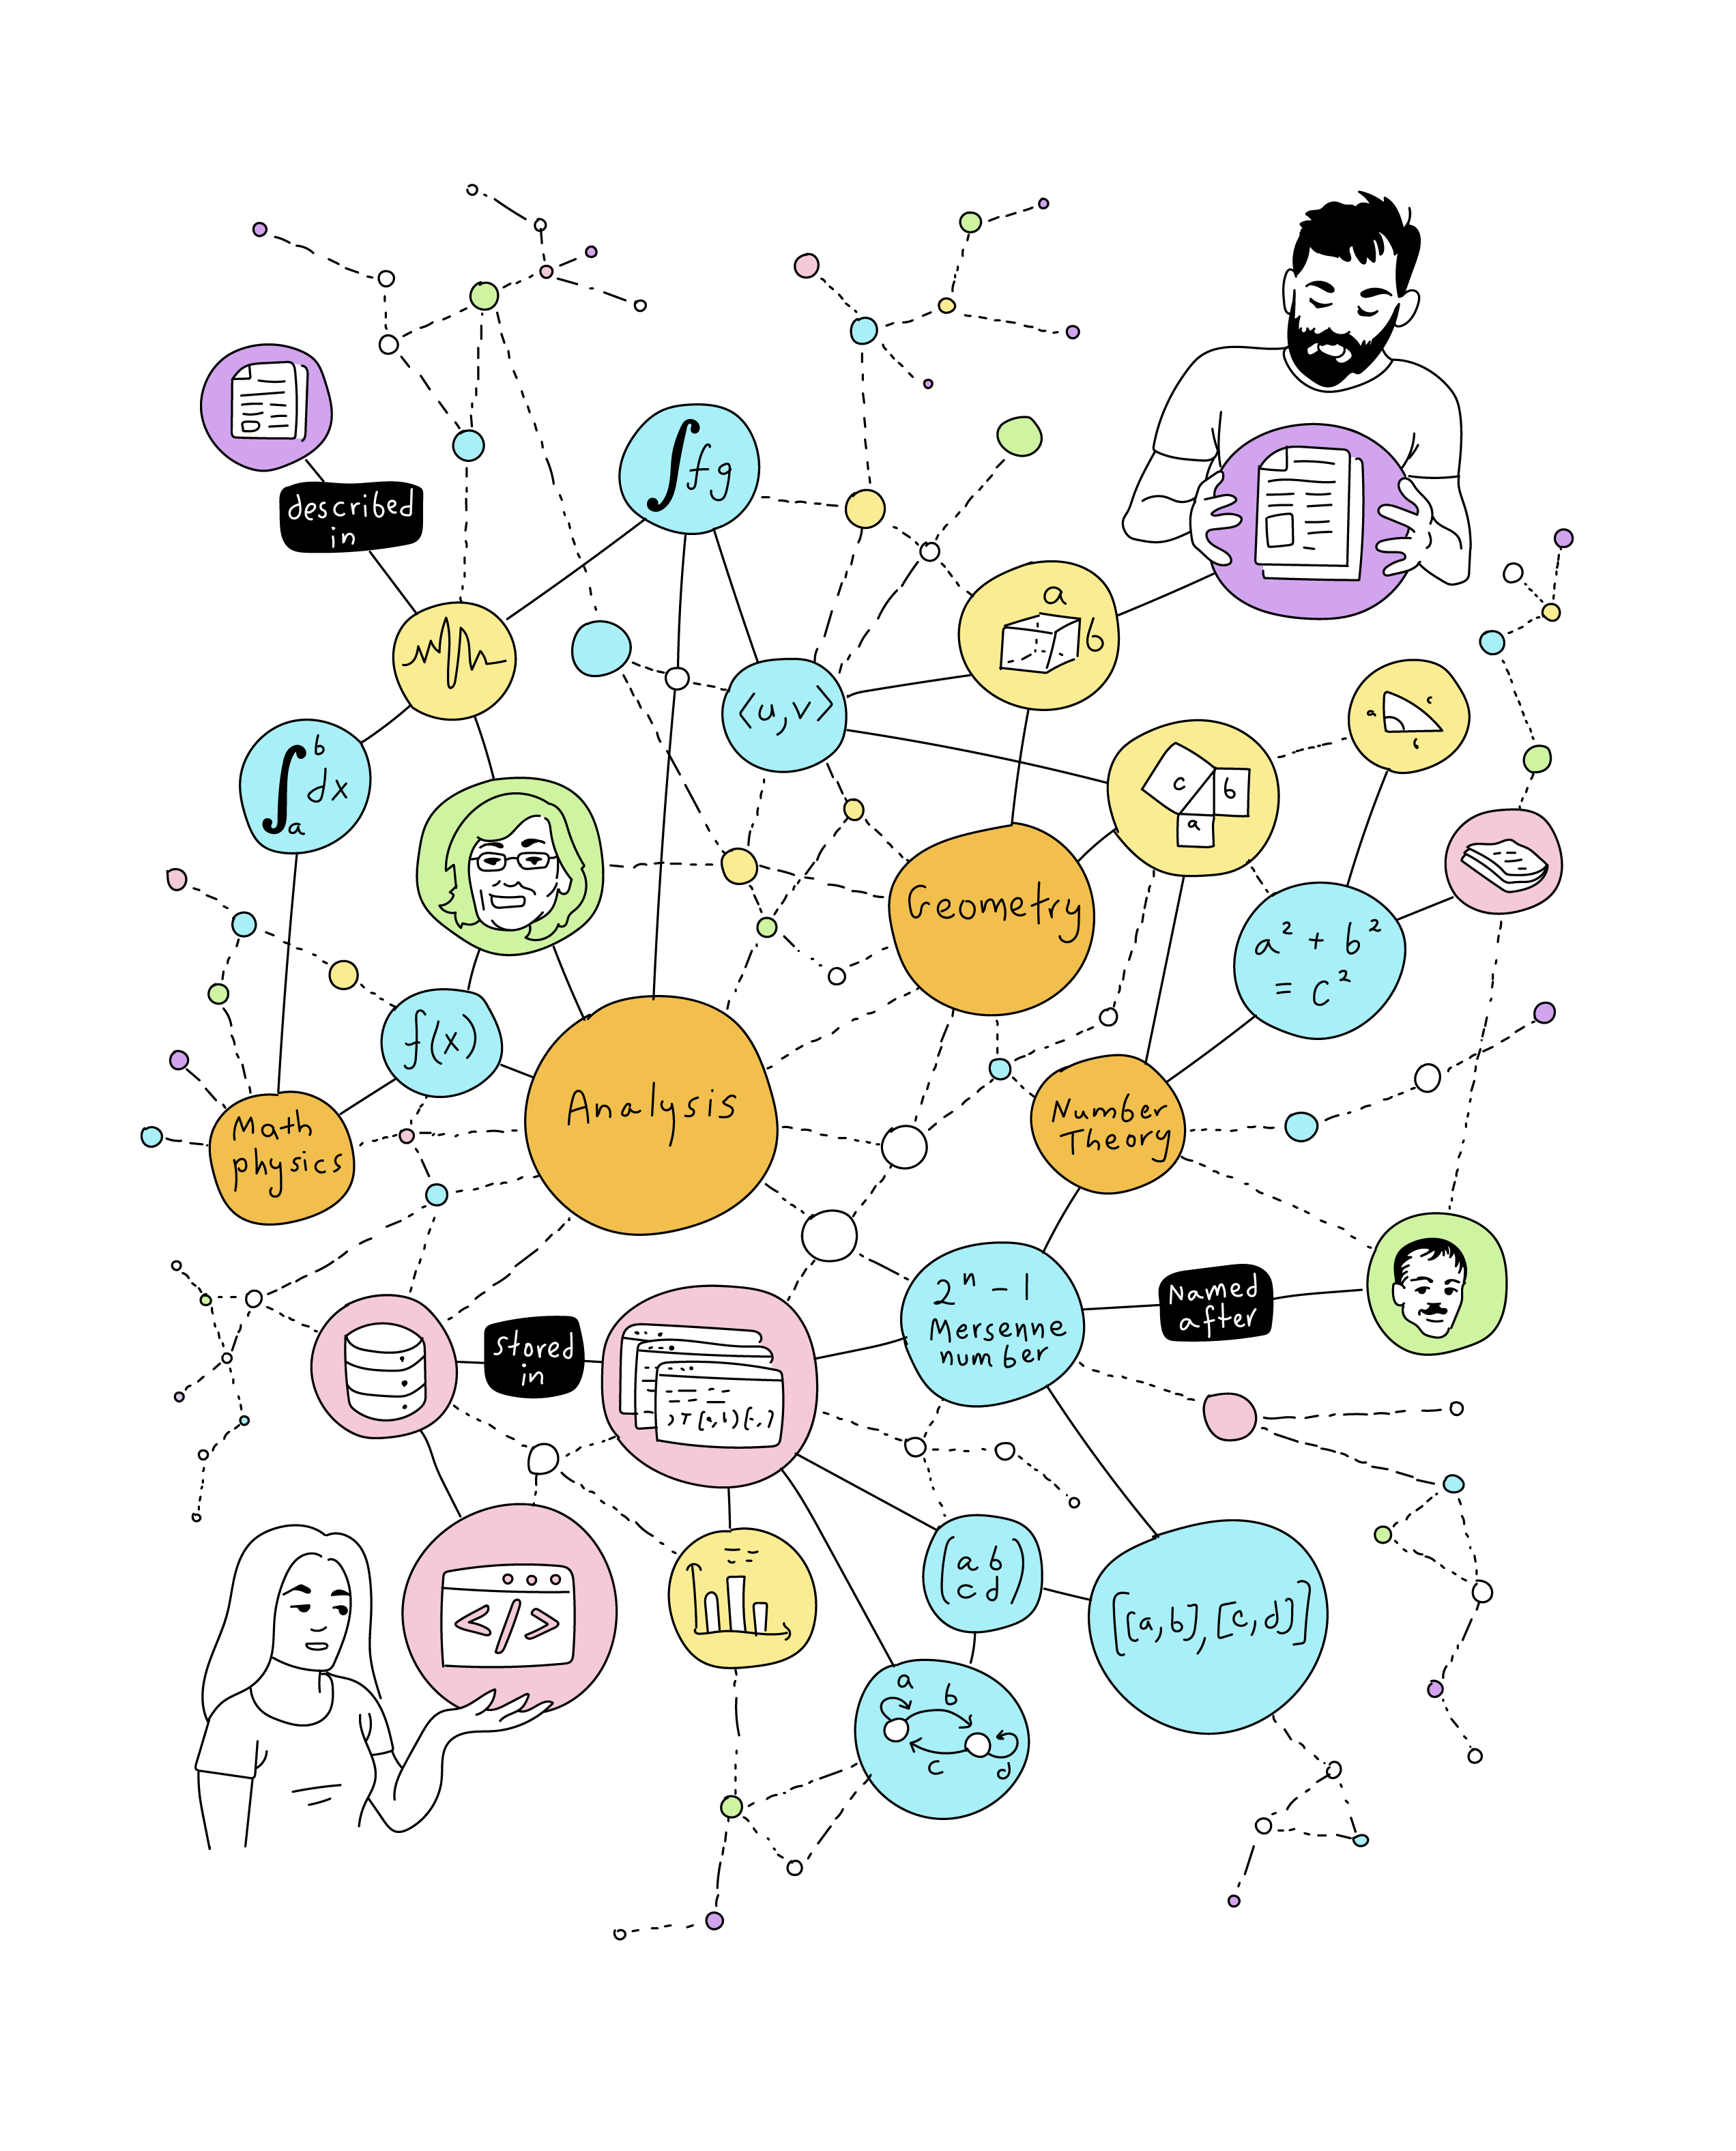
We are not sure exactly how humans store knowledge in their brains, but we certainly pack concepts into units, and then relate those conceptual units together. For example, if asked to list animals, nobody remembers an alphabetical list (unless you explicitly train yourself to remember such a list). Instead, you start the list with something familiar, like a dog, then you recall that dog is a pet animal, and then you list other pet animals like cat or canary. Then you recall that canary is a bird, and then you list other birds, like eagle, falcon, owl… when you run out of birds, you recall that birds fly in the air, which is one environment medium. Another environment medium is water, and this prompts you to start listing fishes and sea animals. This suggests that we can represent human knowledge in the form of a mathematical graph: concepts are nodes, and relationships are edges. This structure is also ingrained in language, which is the way humans communicate and store knowledge. All languages in the world, across all cultures, have nouns, verbs, or adjectives, and establish relationships through sentences. Almost every language organizes sentences in a subject-verb-object pattern (or any permutations: SVO, SOV, VSO, etc). The subject and the object are typically nouns or pronouns, the verb is often a relationship. A sentence like “my mother is a teacher” encodes the following knowledge: the person “my mother” is a node 1, “teacher” is a node 2, and “has as a job” is a relational edge from node 1 to node 2. Also, there is a node 3, the person “me”, and a relationship “is the mother of” from node 1 to node 3, (which implies a reciprocal relationship “is a child of” from node 3 to node 1).
David Somerville / Hugh McLeod
informationversusknowledge-blog.tumblr.com/
A Google search of “Agatha Christie” in June 2023. It offers much more than just links to webs containing the string “Agatha Christie”. Those boxes “About”, “People also search for”, “People also ask”... are powered by Google’s knowledge graph.
Wikipedia (human-readable, non-structured)
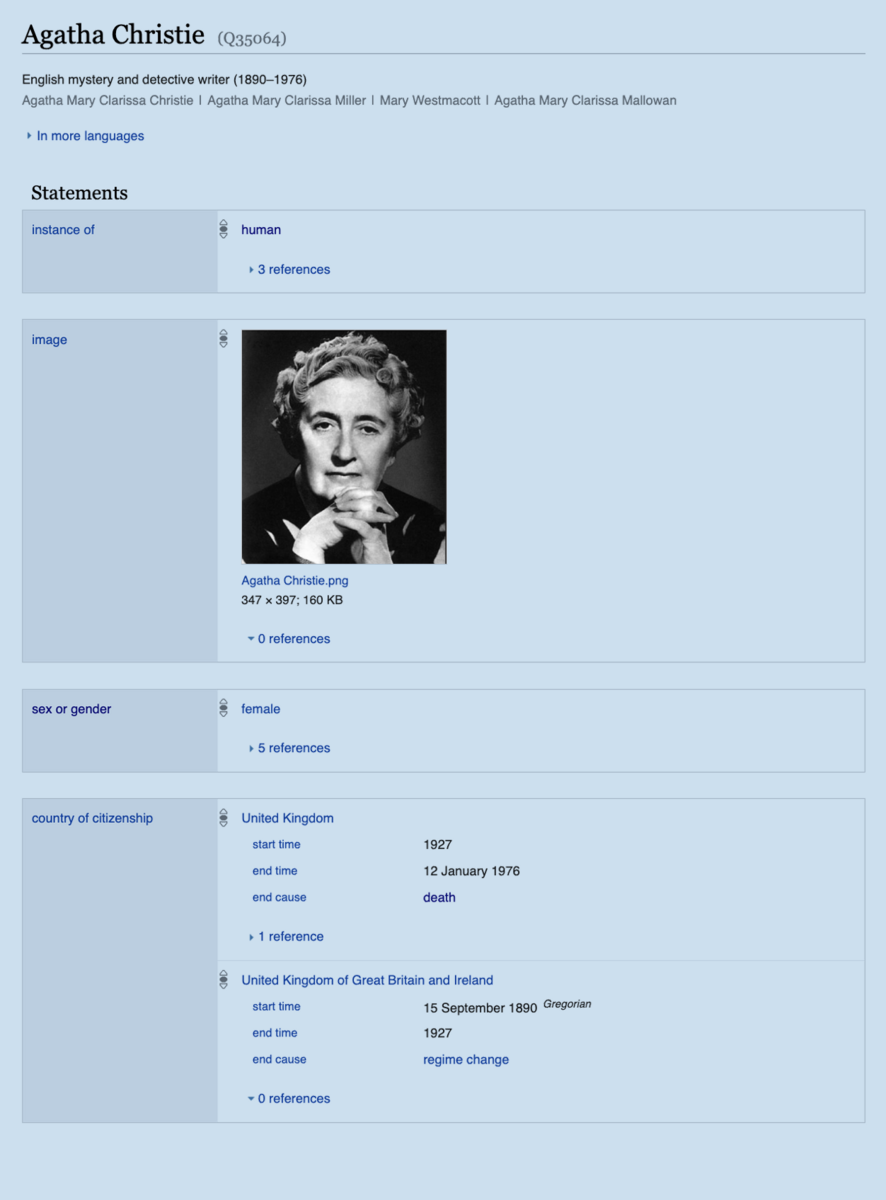
Wikidata (machine-readable, structured)
One of the mottos of MaRDI is “Your Math is Data”. Indeed, from an information theory perspective, all mathematical results (theorems, proofs, formulas, examples, classifications) are data, and some mathematicians also use experimental or computational data (statistical datasets, algorithms, computer code…). MaRDI intends to create the tools, the infrastructure, and the cultural shift to manage and use all research data efficiently. In order to climb up the “knowledge ladder” from Data to Information and Knowledge, the Data needs to be structured, and knowledge graphs are one excellent tool for that goal.
AlgoData
Several initiatives within MaRDI are based on knowledge graphs. A first example is AlgoData (requires MaRDI / ORCID credentials), a knowledge graph of numerical algorithms. In this KG, the main entities (nodes) are algorithms that solve particular problems (such as linear systems of equations or integrate differential equations). Other entities in the graph are supporting information for the algorithms, such as articles, software (code), or benchmarks. For example, we want to encode that algorithm 1 solves problem X, it is described in article Y, it is implemented on software Z, and it scores p points in benchmark W. A use case would be querying for algorithms that solve a particular type of problem, comparing the candidates using certain benchmarks, and retrieving the code to be used (ideally, being interoperable with your system setup).
AlgoData has a well-defined ontology. An ontology (from the Greek, loosely, “study or discourse of the things that exist”) is the set of concepts relevant to your domain. For instance, in an e-commerce site, “article”, “client”, “shopping cart”, or “payment method” are concepts that need to be defined, and included in the implementation of the e-commerce platform. For knowledge graphs, the list would include all types of nodes, and all labels for the edges and other properties. In general-purpose knowledge graphs, such as Wikidata, the ontology is huge, and for practical purposes the user (human or machine) relies on search/suggestion algorithms to identify the property that fits the most to their intention. In contrast, for specific-purpose knowledge graphs, such as AlgoData, a reduced and well-defined ontology is possible, as it simplifies the overall structure and search mechanisms.
The ontology of AlgoData (as of June 2023, under development) is the following:
Classes:
Algorithm, Benchmark, Identifiable, Problem, Publication, Realization, Software.
Object Properties:
analyzes, applies, documents, has component, has subclass, implements, instantiates, invents, is analyzed in, is applied in, is component of, is documented in, is implemented by, is instance of, is invented in, is related to, is solved by, is studied in, is subclass of, is surveyed in, is tested by, is used in, solves, specializedBy, specializes, studies, surveys, tests, uses.
Data Properties:
has category, has identifier.
We can display this ontology as a graph,

The ontology of AlgoData (version 0.1, June 2023)

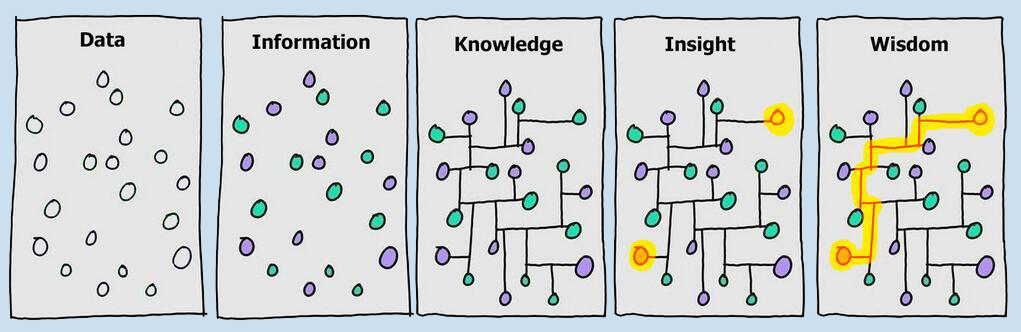
- Knowledge ladder: Steps on which information can be classified, from the rawest to the more structured and useful. Depending on the authors, these steps can be enumerated as Data, Information, Knowledge, Insight, Wisdom.
- Data: raw values collected from measurements.
- Information: Data tagged with its meaning.
- Knowledge: Pieces of information connected together with causal or other relationships.
- Knowledge base: A set of resources (databases, dictionaries…) that represent Knowledge (as in the previous definition).
- Knowledge graph: A knowledge base organized in the form of a mathematical graph.
- Insight: Ability to identify relevant information from a knowledge base.
- Wisdom: Ability to find (or create) connections between information points, using existing or new knowledge relationships.
- Ontology: Set of all the terms and relationships relevant to describe your domain of study. In a knowledge graph, the types of nodes and edges that exist, with all their possible labels.
- RDF (Resource Description Framework): A web standard to describe graphs as triples (subject - predicate - object).
- SPARQL (Simple Protocol And RDF Query Language): A language to send queries (information retrieval/manipulation requests) to graphs in RDF format.
- Wikipedia: a multi-language online encyclopedia based on articles (non-structured human-readable text).
- Wikidata: an all-purpose knowledge graph intended to host data relevant to multiple Wikipedias. As a byproduct, it has become a tool to develop the semantic web, and it acts as a glue between many diverse knowledge graphs.
- Semantic web: a proposed extension of the web in which the content of a website (its meaning, not just the text strings) is machine-readable, to improve search engines and data discovery.
- Mediawiki: the free and open-source software that runs Wikipedia, Wikidata, and also the MaRDI portal and knowledge graph.
- Scholia: A plug-in software for Mediawiki, to enhance visualization of data queries to a knowledge graph
- AlgoData: a knowledge graph for numerical algorithms, part of the MaRDI project.


MaRDI RDM Barcamp
MaRDI, supported by the Bielefeld Center for Data Science (BiCDaS) and the Competence Center for Research Data at Bielefeld University, will host a Barcamp on research-data management in mathematics on July 4th, 2023, at the Center for Interdisciplinary Research (ZiF) in Bielefeld.
More information:
- in English
Working group on Knowledge Graphs
The NFDI working group aims to promote the use of knowledge graphs in all NFDI consortia, to facilitate cross-domain data interlinking and federation following the FAIR principles, and to contribute to the joint development of tools and technologies that enable the transformation of structured and unstructured data into semantically reusable knowledge across different domains. You can sign up to the mailing list of the working group here.
Knowledge graphs in other NFDI consortia can be found for instance at the NFDI4Culture KG (for cultural heritage items) or at the BERD@NFDI KG (for business, economic, and related data items).
More information:
- in English
NFDI-MatWerk Conference
The 1st NFDI-MatWerk Conference to develop a common vision of digital transformation in materials science and engineering will take place from 27 - 29 June 2023 as a hybrid conference. You can still book your ticket for either on-site or online participation (online tickets are even free of charge).
More information:
- in English
Open Science Barcamp
The Barcamp is organized by the Leibniz Strategy Forum Open Science and Wikimedia Deutschland. It is scheduled for 21 September 2023 in Berlin and is open to everybody interested in discussing, learning more about, and sharing experiences on practices in Open Science.
More information:
- in English
- The department of computer science at Stanford University offers this graduate-level research seminar, which includes lectures on knowledge graph topics (e.g., data models, creation, inference, access) and invited lectures from prominent researchers and industry practitioners.
It is available as a 73-page pdf document, divided into chapters:
https://web.stanford.edu/~vinayc/kg/notes/KG_Notes_v1.pdf
and additionally as video playlist:
https://www.youtube.com/playlist?list=PLDhh0lALedc7LC_5wpi5gDnPRnu1GSyRG - Video lecture on knowledge graphs by Prof. Dr. Harald Sack. It covers the topics of basic graph theory, centrality measures, and the importance of a node.
https://www.youtube.com/watch?v=TFT6siFBJkQ The Working Group (WG) Research Ethics of the German Data Forum (RatSWD) has set up the internet portal “Best Practice for Research Ethics”. It bundles information on the topic of research ethics and makes them accessible.
https://www.konsortswd.de/en/ratswd/best-practices-research-ethics/


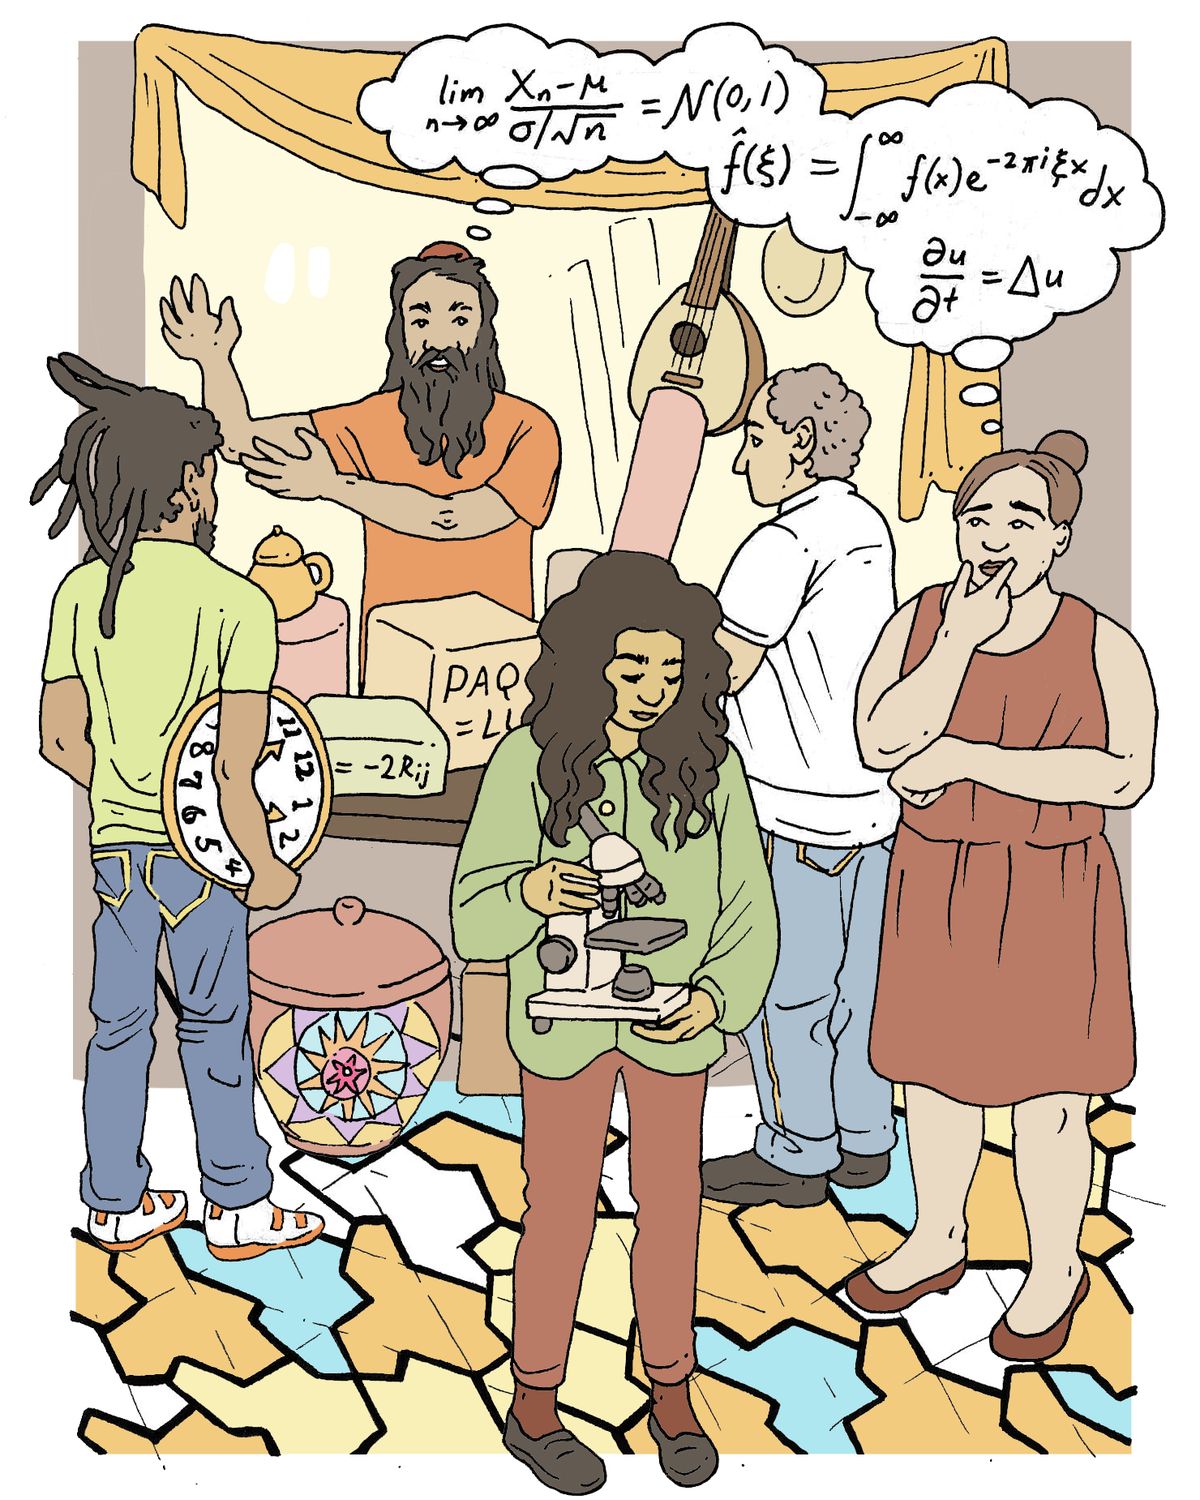
"Yesterday at the Math Bazaar exchanging recent research data..."

Is there Math Data out there?
“Mathematics is the queen and servant of sciences”, according to a quote by Carl F. Gauss. This opinion of Gauss can be a source of philosophical discussions. Is Mathematics even a science? Why does it play a special role? Connecting these questions to our concerns, what is the relationship between research data and these philosophical questions? We cannot arrive at a conclusion in this short article, but it is a good starting point to discuss the mindset (the philosophy, if you wish) that should be adopted regarding research data in mathematical science.
A wide agreement is that a science is any form of study that follows the scientific method: observation, formulation of hypotheses, experimental verification, extraction of conclusions, and back to observation. In most sciences (natural sciences and, to a great extent, also social sciences), observation requires gathering data from nature in the form of empirical records. In contrast, in pure mathematics observations can be made simply by reflection on known theory and logic. In natural sciences, nature is the ultimate judge of the validity or invalidity of a theory. This experimental verification also requires gathering research data in the form of empirical records that support or refute a hypothesis. In contrast, in mathematics, experimental verification is substituted by formal proofs. Such characteristics have prompted some philosophers to claim that mathematics is not really a science, but a meta-science because it does not rely on empirical data. More pragmatically, it can tempt some researchers and mathematicians to say that (at least, pure) mathematics does not use research data. But as you will guess, in the Mathematical Research Data Initiative (MaRDI), we advocate for quite the opposite view.
Firstly, some parts of mathematics do use experimental data extensively. Statistics (and probability) is the branch of mathematics for analyzing large collections of empirical records. Numerical methods are practical tools to perform computations in experimental data. This is the case for pure mathematics as well, where we can build lists of records (prime numbers, polytopes, groups…) that are somewhat experimental.
Secondly, research data are not only empirical records. Data are any raw piece of information upon which we can build knowledge (we discussed the difference between data, information, and knowledge in the previous newsletter). When we talk about research data, we mean any piece of information that researchers can use to build new knowledge in the scientific domain in question, mathematics in this case. As such, articles and books are pieces of data. More precisely, theorems, proofs, formulas, and explanations are individual pieces of data. They have traditionally been bundled into articles and books, and stored in paper, but nowadays are largely available in digital form and accessible through computerized means.
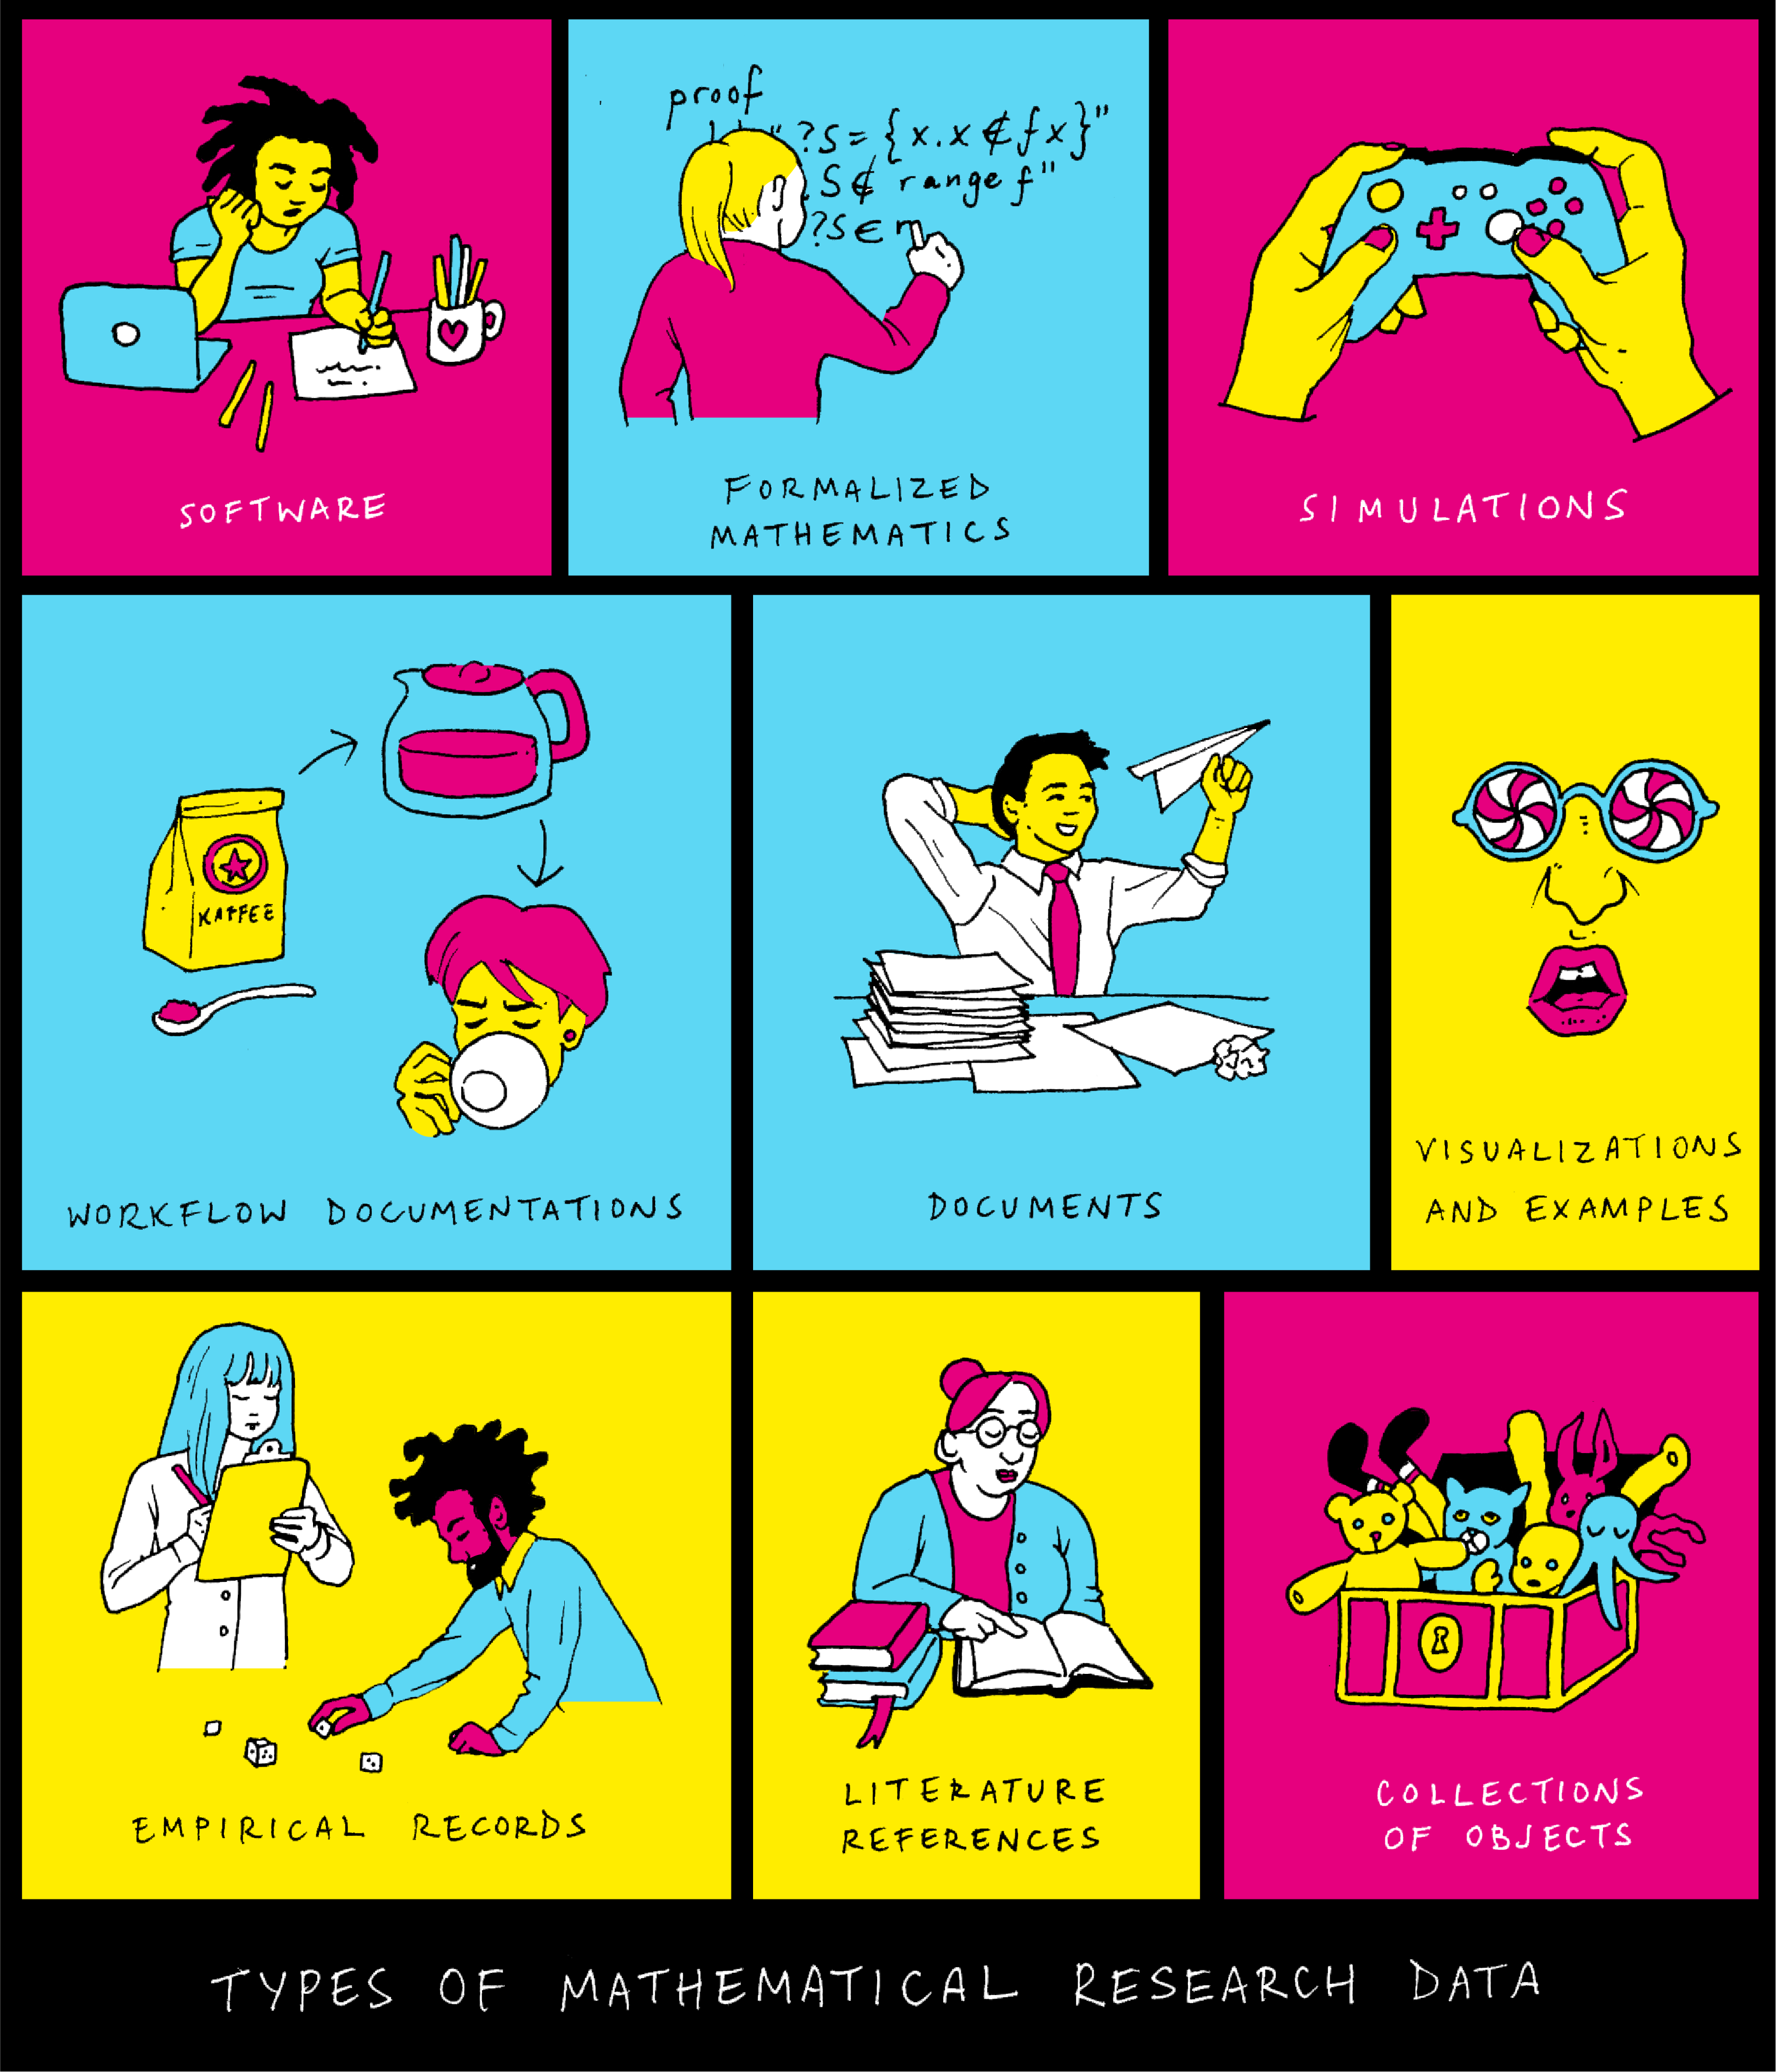
Types of data
In modern mathematical research, we can find many types of data:
Documents (articles, books) and their constituent parts (theorems, proofs, formulas…) are data. Treating mathematical texts as data (and not only as mere containers where one deposits ideas in written form) recognizes that mathematical texts deserve the same treatment as other forms of structured data. In particular, FAIR principles and data management plans also apply to texts.
Literature references are data. Although bibliographic references are part of mathematical documents, we mention them separately because references are structured data. There is a defined set of fields, (such as author, title, publisher…), there are standard formats (e.g. bibTeX), and there are databases of mathematical references (e.g. zbMATH, MathSciNet,...). This makes bibliographic references one of the most curated type of research data (especially in Mathematics) .
Formalized mathematics is data. Languages that implement formal logic like Coq, HOL, Isabelle, Lean, Mizar, etc, are a structured version of the (unstructured) mathematical texts that we just mentioned. They contain proofs verifiable by software and are playing an increasingly vital role in mathematics. Data curation is essential to keep those formalizations useful and bound to their human-readable counterparts.
Software is data. From small scripts that help in a particular problem to wide libraries that integrate into larger frameworks (Sage, Mathematica, MATLAB…). Notebooks (Jupyter,...) are a form of research data that mix text explanations and interactive prompts, so they need to be handled as both documents and software.
Collections of objects are data. Classifications play a major role in mathematics. Either gathered by hand or produced algorithmically, the result can be a pivotal point on which many other works will derive from. Although this output result of a classification can have more applications than the process to arrive at it, it is essential that both input algorithm (or manual process) and the output classification are clearly documented, so that the classification can be verified and reproduced independently, apart from being reused in further projects.
Visualizations and examples are data. Examples and visual realizations of mathematical objects (including images, animations, and other types of graphics) can be very intricate and have an enormous value for understanding and developing a theory. Although examples and visualizations can be omitted in more spartan literature, if provided, they deserve a full research data curation as other research data essential to logical proofs.
Empirical records are data. Of course, raw collection of natural information, intended to be processed to extract knowledge of the data itself, or from the statistical method, are data that need special tools to handle. This applies to statistical databases, but also to machine learning models that require vast amounts of training data.
Simulations are data. Simulations are lists of records not measured from the outside world, but generated from a program. This is usually a representation of a state of a system, including possibly some discretizations and simplifications of reality in the modeling process. As with collections, this output simulation data is as necessary as the input source code that generates it. Simulation data is what allows us to extract conclusions, whereas the reproducibility verification requires that the processing input-to-output be performed by a third party, allowing the recognition of flaws or errors in either the input or the output, or allowing for the rerun of the simulation with different parameters.
Workflow documentations are data. More general than simulations, workflows involve several steps of data acquisition, data processing, data analysis, and extraction of conclusions in many scientific researches. An overview of the process is in itself a valuable piece of data, as it gives insights into the interplay of the different parts. A numerical algorithm can be individually robust and performant, but it may not be the best fit for the task at hand. We can only spot such issues when we have a good overview of the entire process.
The building of mathematics
One key difference between mathematics and other sciences is the existence of proofs. Once a result is proven, it is true forever, as it cannot be overruled by new evidence. The Pythagorean theorem, for instance, is today as valid and useful as it was in the times of Pythagoras (or even in the earlier times of ancient Babylonians and Egyptians, who knew and used it. However, the Greeks invented the concept of proof, turning mathematics from a practice into a science). The Book of Elements by Euclid, written circa 300 BC, one of the most relevant books in the history of mathematics and mankind, perfectly represents the idea that mathematics is a building, or a network, in which each block is built on top of others, in a chain starting with some predetermined axioms. The image shows the dependency graph of propositions in Book I of the Elements.
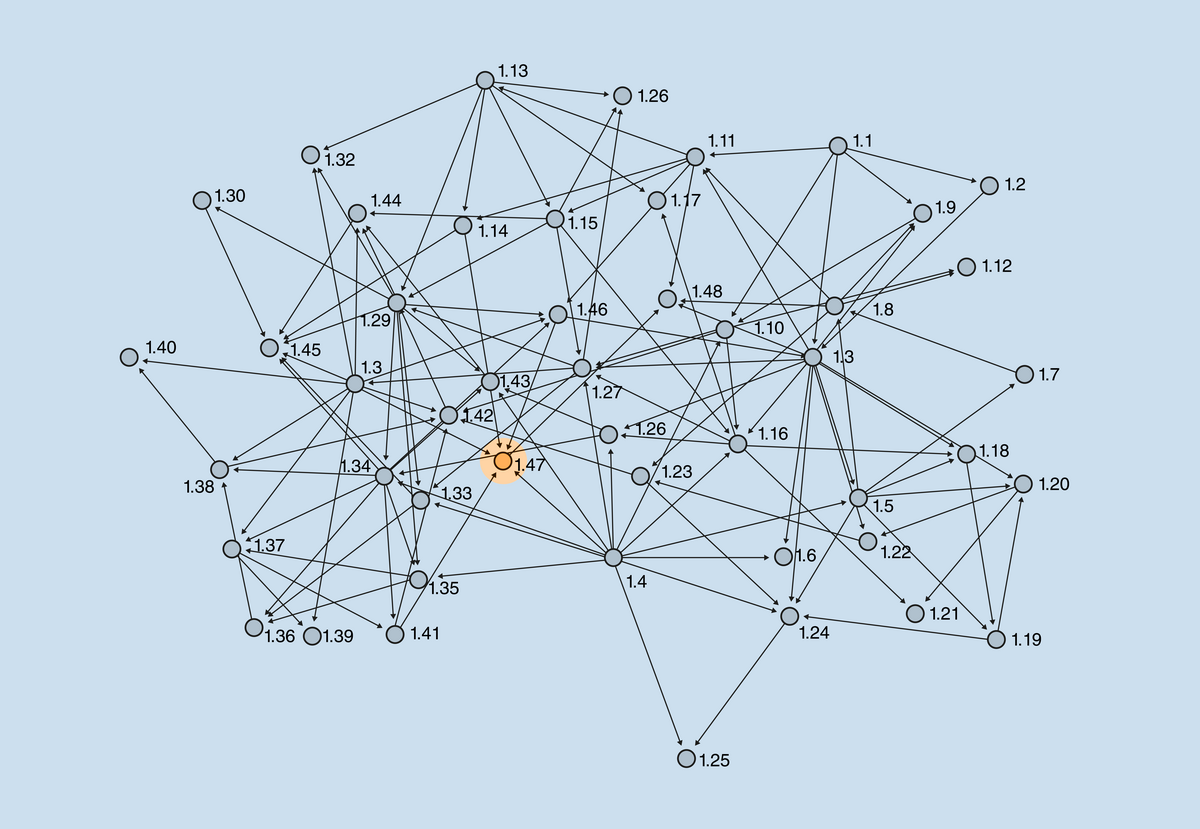
Dependency graph of propositions in Book I of Euclid’s Elements (source). Proposition I.47 is the Pythagorean theorem.

image credit: NFDI-MatWerk
image credit: Heike Fliegl (FIZ)
Math Meets Information Specialists, October 09 - 11, 2023, MPI MiS, Leipzig
MaRDI invites information specialists, librarians, data stewards, and mathematicians to discuss mathematical research data, present their own ideas and services, and make new connections in a three-day noon-to-noon workshop with talks, hands-on sessions, and a barcamp. The workshop will be held in German.
More information:
- in German
Data-Driven Materials Informatics, March 4 - May 24, 2024
The aim of this long program at IMSI is to bring together a diverse scientific audience, both between scientific fields (physical sciences, materials sciences, biophysics, etc.) and within mathematics (mathematical modeling, numerical analysis, statistics, data analysis, etc.), to make progress on key questions of materials informatics.
More information:
- in English
RDM with LinkAhead, September 29, 2023, online
At the NFDI4Chem Stammtisch, the research data management software LinkAhead will be introduced. This agile, open-source software toolbox enables professional data management in research where other approaches are too rigid and inflexible. It will make your data findable and reusable.
More information:
NFDI Code of Conduct
The Consortial assembly, comprising the speakers of each consortium, voted on 27 June 2023 to adopt the code of conduct for the NFDI. This Code of Conduct is intended to provide a binding framework for effective collaboration within the NFDI association.
More information:
- in German
- A a generic JSON based file format which is suitable for computations in computer algebra is described in the paper A FAIR File Format for Mathematical Software by Antony Della Vecchia, Michael Joswig, and Benjamin Lorenz. This file format is implemented in the computer algebra system OSCAR, but the paper also indicates how it can be used in a different context.
- To understand our world, we classify things. A famous example is the periodic table of elements, which describes the properties of all known chemical elements and classifies the building blocks we use in physics, chemistry, and biology. In mathematics, and algebraic geometry in particular, there are many instances of similar periodic tables, describing fundamental classification results. In his article, The Periodic Tables of Algebraic Geometry, Pieter Belmans invites you on a tour of some of these results. It appeared within the series 'Snapshots of modern mathematics from Oberwolfach'.
- Play with the educational tool Classified graphs. With this open-source web app you can draw any graph, or select one from a collection, and then compute a few invariants, such as the adjacency determinant. In the Identify mode, you are challenged to find out which of the graphs in the collection is shown as a target. The tool is part of Pieter Belmans's project Classified maths.
- In each episode of the podcast "Mathematical Objects", Katie Steckles and Peter Rowlett chat about some aspect of mathematics using a mathematical object as inspiration. The podcast is also available on YouTube.
- Proceedings of the Conference on Research Data Infrastructure (CoRDI):
https://www.tib-op.org/ojs/index.php/CoRDI/issue/view/12


Data Management: From Theory to Practice
In previous MaRDI newsletter articles, we discussed what is Mathematical Research Data, the guiding principles that define proper, good quality research data (the FAIR principles), and why as a researcher you should care about your data. It is time now to raise the question of how to properly curate your research data in practice.
Research Data Management (RDM) refers to all handling of data related to a research project. It includes a planning phase (written as a formal RDM plan and included in an application for funding agencies), an ongoing data curation and plan revision during the project, and an archival phase at the conclusion of the project.
In this article, we will survey the main points to consider for proper data management. There are, however, more comprehensive and detailed guides that you can use to create your own RDM plan. The MaRDI community has written a report on Research-data management planning in the German mathematical community, and a whitepaper (Research Data Management Planning in Mathematics) that will be helpful in the context of mathematics. You can also get useful resources from other NFDI consortia, such as the FAIRmat Guide to writing a Research Data Management Plan.
Writing an RDM plan
An RDM plan is a document that describes how you and your team will handle the research data associated with your research project. This document is a helpful reference for the researchers on how to fulfill data management requirements. It is a standard requirement nowadays from many funding agencies on their application regulations for projects.
There are several standard key points to consider in an RDM plan. These points were developed by Science Europe and have been adopted across agencies internationally. You can check the evaluation criteria for each point that evaluators are likely to use when reviewing your application. In Germany, the key requirements are given by the German Research Foundation, the DFG.
Data description
First and foremost, you need to know the type of data you will be handling. Start by describing the types of data involved in your project (experimental records, simulations, software code…). It is a good idea to separate data by its provenance: internal data is data generated within the project, whereas external data is data used for the project that is generated elsewhere. When recording internal data, specify the means of data generation (by measuring instruments in the laboratory, by software simulation, written by a researcher…). As for the documentation of external data, include details of any interface/compatibility layer used (for instance format conversions).
Workflows of data are in itself a type of data. If you process data in a complex way (combining data from different sources, involving several steps, using different tools and methods…) the process in itself, the workflow, is something that should be properly documented and treated as research data.
Plan in advance the file formats required for recording, the necessary toolchains, and other aspects that affect interoperability. Prioritize the use of open formats and standards (if you need to use proprietary formats, consider saving both the proprietary and an exported copy to an open format). Finally, estimate the amount of data you will collect, and any other practical needs that you or anyone using the data will require. As you cannot foresee in detail the various data requirements (for instance, you may not know the specific software tools necessary to solve your problem), your RDM plan should be updated at a later stage if the type, volume, or characteristics of your data change significantly.
In mathematics, it is likely that you will generate some text and pdf files for your texts, with graphics from different sources. If your bibliographies grow above a hundred references, you may use separate BibTeX files (.bib) that you can re-use across publications, and constitute a usually overlooked piece of research data.
If your project involves computations, you will have scripts, notebooks, or code files that serve as input for your computation engine. Your system will require a toolchain to work, for instance, a particular installation of Singular, OSCAR, MatLab, a C compiler…, together with some installed libraries and dependencies. You may use an IDE or a particular text editor (while that may seem a personal choice not relevant for other users, it is in fact quite useful to know how some software was developed in practice). This toolchain is also a piece of research data that needs to be curated. You may have output files that require documentation, even if they can be recreated from the inputs. If your project involves third-party databases, these should be properly referenced and sourced.
Documentation and data quality
Data must be accompanied by rich metadata that describes it. Your documentation plan should state the metadata you need to collect, and explain how it will stay attached to the data. Once you have a description of your data, you need to organize it. Create a structure that will accommodate all the generated data. The structure can include some hierarchy in your filesystem, conventions for naming files, or another systematic way to find and identify your data easily. Do not call your files “code.sing”, “paper.tex” or “example3_revised 4 - FINAL2.txt”, instead use meaningful names such as “find_eigenvalues.nb” and start your document with comments explaining what this file is, the author, language, date, references to theory, how to run it, and any other useful information.
Good documentation will be a crucial step in enabling the reusability of the data. If you are developing a software library, you need to document the functions, APIs, and other parts of the software, including references to the theoretical sources that your algorithms are based on. If you are curating a database or a classification of mathematical objects, you need to document the meaning of fields in your tables, the formulae for derived values, etc. If parts of the data can be re-generated (for example, as a result of a simulation), you should describe how to do so, and differentiate clearly between source data and automatically generated data.
Data quality refers to the FAIRness of the data, which needs to be checked and addressed during the implementation phase. At the planning stage, you can provide metrics to evaluate data quality, and provide quality control mechanisms. For instance, checking the integrity of data periodically, and testing whether the whole toolchain can be installed and executed successfully. You can plan a contingency in case some tools become obsolete or unavailable.
Storage and archiving
Storing and archiving research data is not a trivial matter and should be planned carefully. On one hand, it requires security against data loss (or data break in case of sensitive data), and on the other hand, it needs to be accessible to all the researchers involved, in a practical way.
Your storage strategy should take into account the amount of data (large volumes of data are more difficult to move and preserve), its persistence (experiments are recorded usually only once, whereas an article or computer code is rewritten again and again with improvements), the number of people needing write access, or the sensitivity of the data (for instance, data related to people can have private information that needs to be anonymized and access-controlled, whereas non-sensitive data can be put in public repositories).
Backup plans should include keeping several copies of the data, in different physical locations and different media. Important key files (e.g. indices or tables listing contents of other files) should be specially protected and backed up. Synchronizing and keeping up versions of data is also important to avoid unorganized data. If your team has several people needing write access to the same data, you need appropriate tools to avoid conflicting versions, such as online multi-user editors (e.g. Overleaf, Nextcloud/collabora, Google docs…), or version control systems. Remember to always backup a local copy and not keep your only copy on the cloud. A good scientific practice is to keep your storage for at least 10 years after publication or project completion.
Legal and ethical obligations
It is important to be safe with the legal obligations associated with data, and related ethical considerations that may arise.
All data should be associated with an author or an owner, who has the right to decide a license and control its access, usage, and other legal prerogatives. Intellectual property and copyright may apply to some data, like patents, software, commercial products, or publications. Intellectual property protects ideas (but not facts of nature), while copyright protects an expression of an idea. In mathematics, a theorem cannot be protected by intellectual property (since it is a fact of nature), while an algorithm for a practical purpose or its implementation in software could be protected by it. The text of a scientific article is generally protected by copyright, even if the ideas contained therein are free. If the copyright of your written texts is to be transferred to a publisher (as it is standard practice), you should state the conditions that are acceptable within your project and your publication strategy (see next section).
Sensitive data (e.g. medical records, personal information…) require a specific data handling policy with special attention to data protection and access.
In all cases, you should include an appropriate license note, after evaluating all implications. For open licenses, you should prefer standard licenses (for instance Creative Commons or free/open software licenses) instead of crafting your own licenses or adding/removing clauses, which can lead to license incompatibilities and encumber its reusability. See our article on Reusability.
Data exchange
Data exchange involves an integration of the project and its data with the community. Data should be readily found, accessed, operated, and reused by anyone with a legitimate interest in it. In practice, this data exchange will involve a data preservation strategy for the long-term (archiving), as well as a dissemination strategy (using community standards to share data).
While the storage and archiving section above concerns mainly data security and preservation, this data exchange section focuses on the FAIRness (and specially the accessibility) of the data and its exchange within the community. Naturally, both topics overlap. FAIRness of data is heavily affected by the FAIRness of the repositories or hosting solutions that store and make this data accessible. Look for FAIR and reliable repositories in your domain that can host online versions of your data during the implementation of the project and also act as a long-term archiving solution.
In this section, you can include the publication strategy for your research articles. This includes, whether you plan to publish pre-prints or final articles in free repositories (like arXiv), or whether you consider publishing only in open-access journals, etc. Though there are comprehensive catalogs for literature in mathematical research (zbMATH open, MathSciNet), it is always good to ensure that your publications are findable and accessible. For other types of data, you should carefully consider their dissemination, and ensure that your data is listed in relevant catalogs.
Responsibilities
All research data needs someone to take care of it. A person (or a team) must take responsibility for the research data in the project. This responsibility may be that of the owner/author, or someone else. A data steward can be appointed to help with the technical aspects of data management. There can also be teams designated with different responsibilities during different phases of the project (planning, implementation, archiving), but they should be public and well defined, and serve as a contact point during and after the project.
In case the data is meant to be static (no changes in the future), then the responsible person is only answerable for what has been published. If, on the other hand, the data is expected to grow in the future (for instance a growing classification of mathematical objects), a maintainer should be appointed for the future, to take care of advances in the field and incorporate the data to its appropriate place. In case the maintainer can no longer take care of that role, the position should be transferred to another suitable person/team, for as long as the project needs a maintenance team.
MaRDI RDM consulting
We can offer a couple of examples of RDM plans from MaRDI, developed in the context of mathematics by MaRDI members. First, for a project applying statistical analysis to datasets containing student records for a study in didactics [RDMP1]. Second, for a project that develops algorithms and software with applications in robotics [RDMP2]. These are prototypes we prepared along with RDM experts from Leipzig university for mathematics projects planned by our researchers. We handed these out as examples to the community at the DMV annual meetings in 2022 and 2023.
MaRDI can offer consulting services for math projects that need help with creating their own RDM plan, or just figuring out the necessary infrastructure and best practices for a FAIR RDM. You can contact the MaRDI Help Desk for more information.
Tools for keeping your RDM up
There are some existing tools to help researchers plan and fulfill an RDM plan. These can be used in small or individual projects, though they are meant for large projects involving many researchers. We will briefly discuss Research Data Management Organizer (RDMO), a web-based service widely used in German research institutions.
RDMO is a free open-source software developed as a DFG project, meant to run as a web service in your institution's infrastructure. Normally, a data manager (data steward) will play an administrator’s role and install the RDMO software in a server with access to the institution researchers. The data manager will create questionnaires for handling the data of a specific project. That questionnaire will be available in an online form that researchers can fill-in for each piece of data that they create or gather. By analyzing this questionnaire, a standardized file can be exported, that serves as metadata of the described data. Template questionnaires are available, so that all relevant information is included (e.g. the DFG guidelines). The questionnaires can also be used to generate a standardized RDM plan for the project. No data is actually stored or handled in the RDMO platform, RDMO and other RDM tools only handle metadata and help with organization. You still need to store and structure your research data, ensure data quality, apply licenses, manage data exchange, etc. These tasks are not automated by any RDM tool and you are still in charge of implementing your RDM plan.
Some institutions will require you to use this platform to prepare RDM plans for their research projects. Such a case is Math+ excellence cluster at Zuse Institute Berlin. A version of the questionnaire that ZIB researchers use is available in [Quest1] (also published here in XML format; the actual RDMO instance is only available to ZIB users). Using such a system reduces the possibility of unintended omissions, ensures compatibility with the guidelines of their funding agency (DFG), and uniformizes RDM plans across different projects.
MaRDI is also actively using RDMO as part of its task area devoted to interdisciplinary workflows. Workflows are important research data for projects involving researchers from different disciplines, making its management particularly challenging. MaRDI has prepared an RDMO questionnaire that can describe workflows in a MaRDI standard way, you can have a look in [Quest2] (also published here in XML format). Additionally, MaRDI is developing MaRDMO, an RDMO plug-in that can be installed on the instance of RDMO you use (a live demo will be soon available). This plug-in will add the feature of exporting the documented workflow metadata directly to the MaRDI knowledge graph, and make it findable and accessible through the MaRDI portal. This will provide a streamlined method to populate the MaRDI knowledge graph directly from the researchers, with the same tool they used to create an RDM plan and manage their RD metadata.


Workshop on RDM in Modelling in Computer Science
This NFIDxCS workshop is a base for discussing systematic approaches to dealing with research data. The workshop aimed to gather individuals willing to contribute to the handling of research data management. The result will be a manifesto for research data management in modeling research (in Computer Science). Date: March 11, 2024, submission deadline: January 8, 2024.
More information:
- in English
Data Management Plan Tool
The German Federation for Biological Data (GFBio) offers a Data Management Plan (DMP) Tool. It will help you find answers to important questions about the data management of your project, and create a structured PDF file from your entries. You can also get free personal DMP support from their experts.
More information:
- in English
Mailing list “Math and Data Forum”
The MaRDI mailing list “Math and Data Forum” offers news and insights into the realm of mathematical research data as well as a discussion forum for research data management practices and services in mathematics.
More information:
Special ITIT Issue Data Science and AI within the NFDI
Data Science and AI is an interdisciplinary field that is important for many NFDI consortia. This special issue of the journal "it - Information Technology" will focus on recent developments in Data Science and AI in the different consortia. Submission deadline: January 31, 2024.
More information:
- in English
The whitepaper Research Data Management Planning in Mathematics by the MaRDI consortium aims to guide mathematicians and researchers from related disciplines who create research data management (RDM) plans. It highlights the benefits and opportunities of RDM in mathematics and interdisciplinary studies, showcases examples of diverse Math research data and suggests technical solutions that meet the requirements of funding agencies with specific examples.
This guide to writing a Research Data Management Plan by FAIRmat provides you with comprehensive information and practical tips specific to the fields of condensed-matter physics and materials science on creating a data management plan (DMP) that meets the DFG requirements and aligns your research with the FAIR data principles, the DFG code of conduct, and the EU open science policy.
The DFG guidelines on Research Data Management (2021) include this Checklist for planning and description of handling of research data in research projects.
The EMS article "Research-data management planning in the German mathematical community" by Tobias Boege and many other MaRDIans discusses the notion of research data for the field of mathematics and reports on the status quo of research-data management and planning.
Science Europe offers a practical Guide to the International Alignment of Research Data Management. Find the Extended Edition here.
The review Making Mathematical Research Data FAIR: A Technology Overview by Tim Conrad and several other MaRDIans aims to perform a technology review on existing data repositories/portals with a focus on mathematical research data.
- MaRDIan Daniel Mietchen was invited to give an NFDI InfraTalk on Scholia - an open-source profiling tool to explore scholarly knowledge via open data from Wikidata. He is one of the core developers of Scholia, which provides dozens of profile types, each composed of multiple panels that render pertinent information based on a predefined SPARQL query that is parametrized via the Wikidata identifier of the concept to be profiled. It also facilitates collaborative curation of this information in Wikidata. Luckily, the talk was recorded and is available on YouTube for you to watch.
In the rather short article Share and share alike: Top 5 reasons to share your research data! Isabel Chadwick convinces you to share your data by highlighting some key benefits.